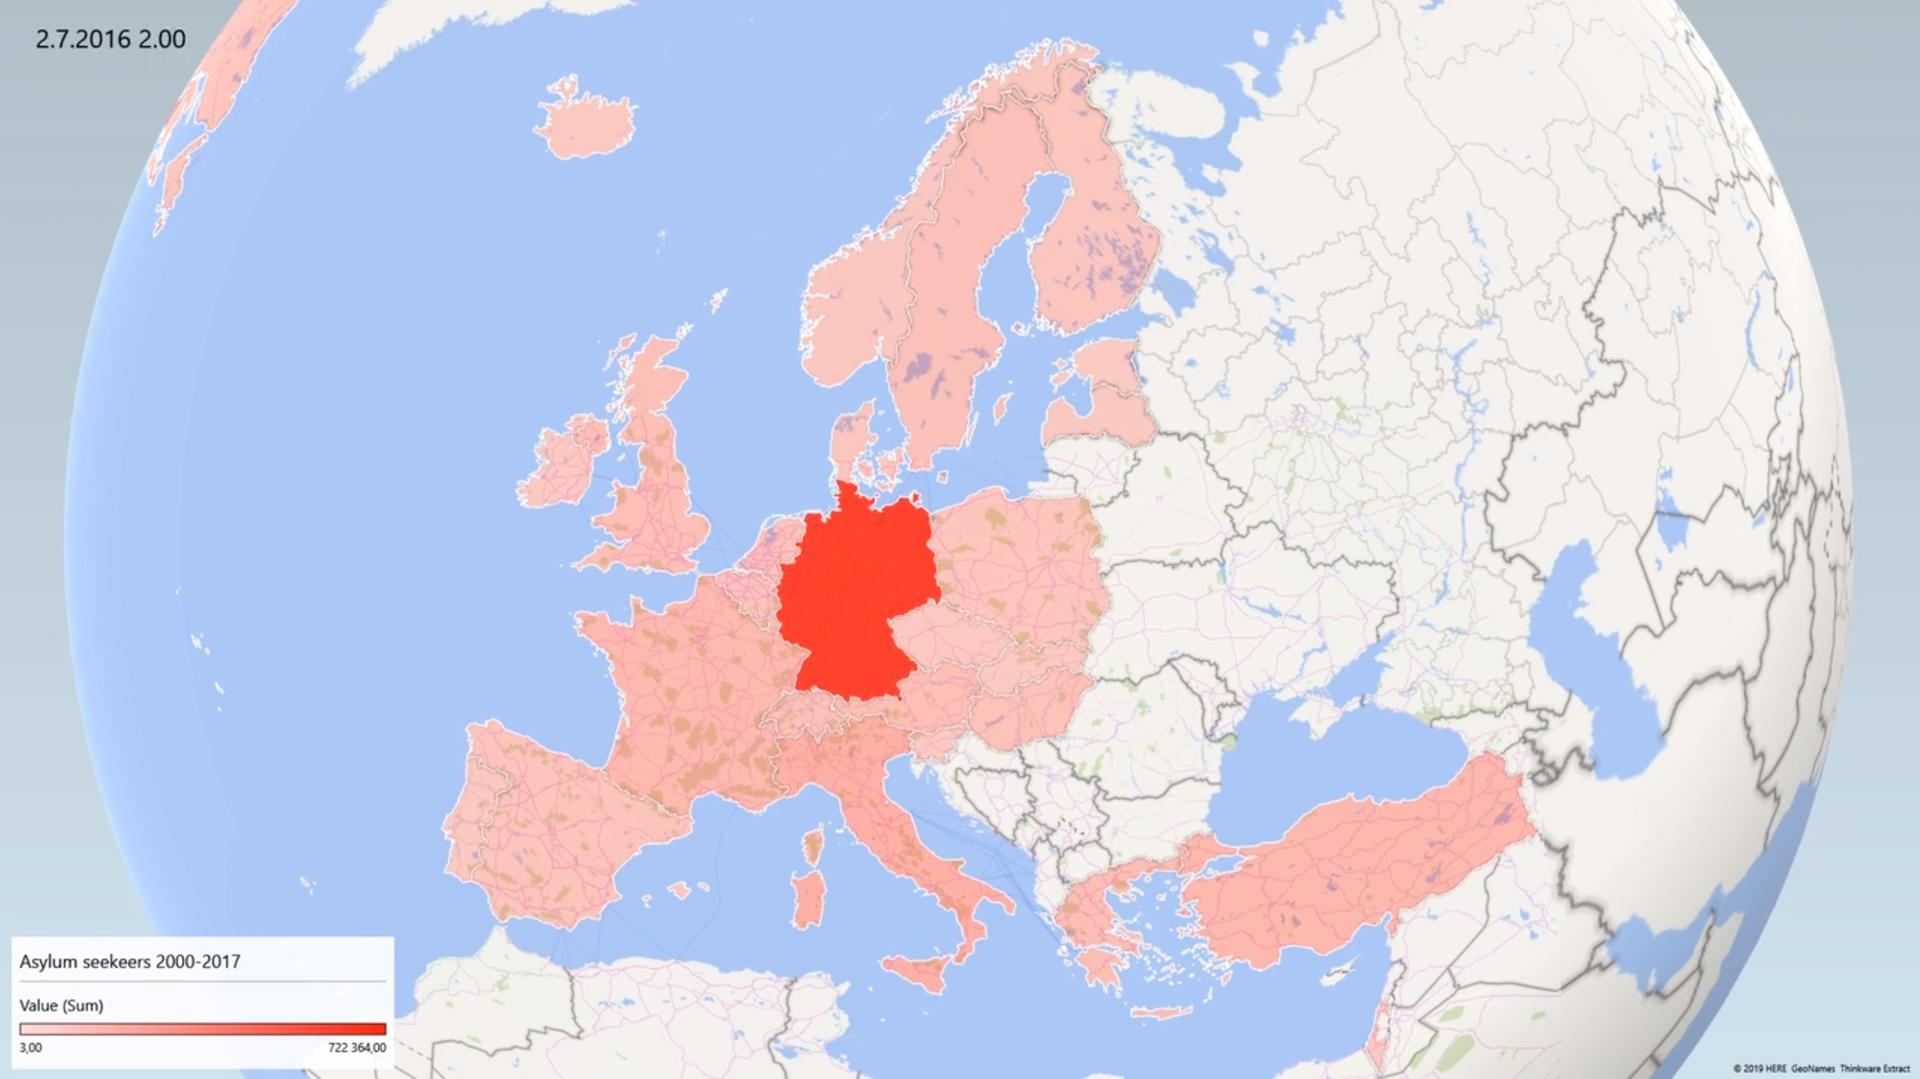
Excel Power Map is designed to visualize spatial data. The tool is also known as Excel 3D Map.
Watch my Power Map demo video from Solita’s blog here .
The demo video visualizes annual asylum seeker data in different geograhical areas. The linked blog post has also a tutorial to import data and adjust settings in Power Map.
How to use Power Map in Excel?
In the past Power Map was a separate add-in for Excel. Nowadays you find it in the Excel ribbon menu from Insert > 3D Map.
What is Excel Power Map good for?
Power Map is useful to quickly visualize Excel data. Creating a simple 3D Map visualization shouldn’t be too much effort even for a Power Map first-timer.
It’s also possible to include map visualizations as a part of regular reporting. Often this requires help from other Microsoft tools such as Excel Power Query or Power BI.
Custom map feature allows user to extend the capabilities of the Power Map. In addition to geographical maps you can visualize for example a factory layout, a sudoku grid or astronomical charts. A fun use case would the beer pong game from which I have written an analytical article in Finnish: Beer Bong analytics.


Write a new comment
The name will be visible. Email will not be published. More about privacy.