Reading and visualizing Finland’s postal code data on a map in Python. Python has many great packages to work with geospatial such as geopandas.
Download the postal code data
To get started, download the Finnish postal code data.
Python workspace for postal code visualization
The examples work best in Jupyter notebook environments.
If you don’t want to setup Python and the required libraries on your own, you can choose from these options free browser-based Python workspace.
Reading data into Python
Postal code data can be read into Python with geopanads library in GetJSON file format.
Here you can copy the Python code to get started with postal codes.
import matplotlib.pyplot as plt
import geopandas as gpd

input_file = "finland-postal-codes-sample.geojson"

gdf = gpd.read_file(input_file)
#Derive a silly value from postal code to colorize the regions
gdf["fake_value"] = (gdf["postinumeroalue"].astype("int")-10000) / 30000

fig, ax = plt.subplots(figsize=(10,10))
#Set longitude limits to show in the map
plt.xlim(21.2, 24.5)
#Set latitude limits to show in the map
plt.ylim(59.8, 62)

#Use Finland map as a background
world = geopandas.read_file(geopandas.datasets.get_path('naturalearth_lowres'))
finland = world[(world.pop_est>0) & (world.name=="Finland")].copy()
finland.plot(ax=ax, color="lightgray", edgecolor='gray')

#Plot the postal code on top
gdf.plot(ax=ax, edgecolor="white", alpha=gdf.fake_value)
A simple visualization of postal code data using Python’s matplotlib library looks like this:
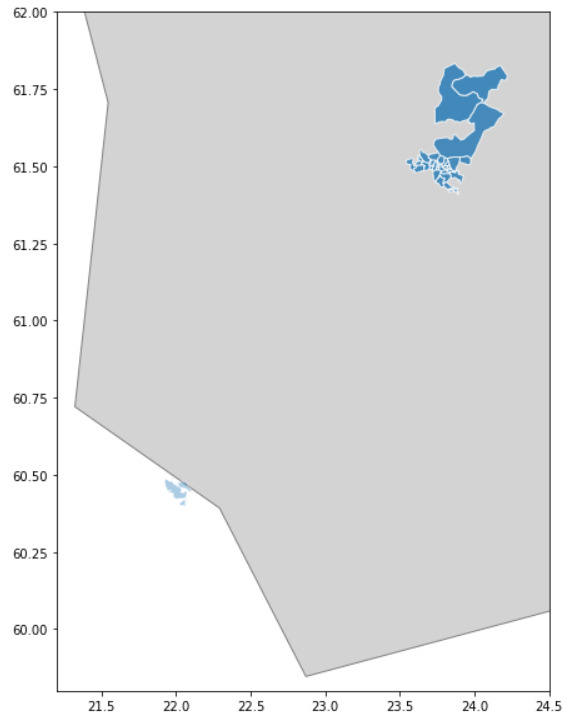
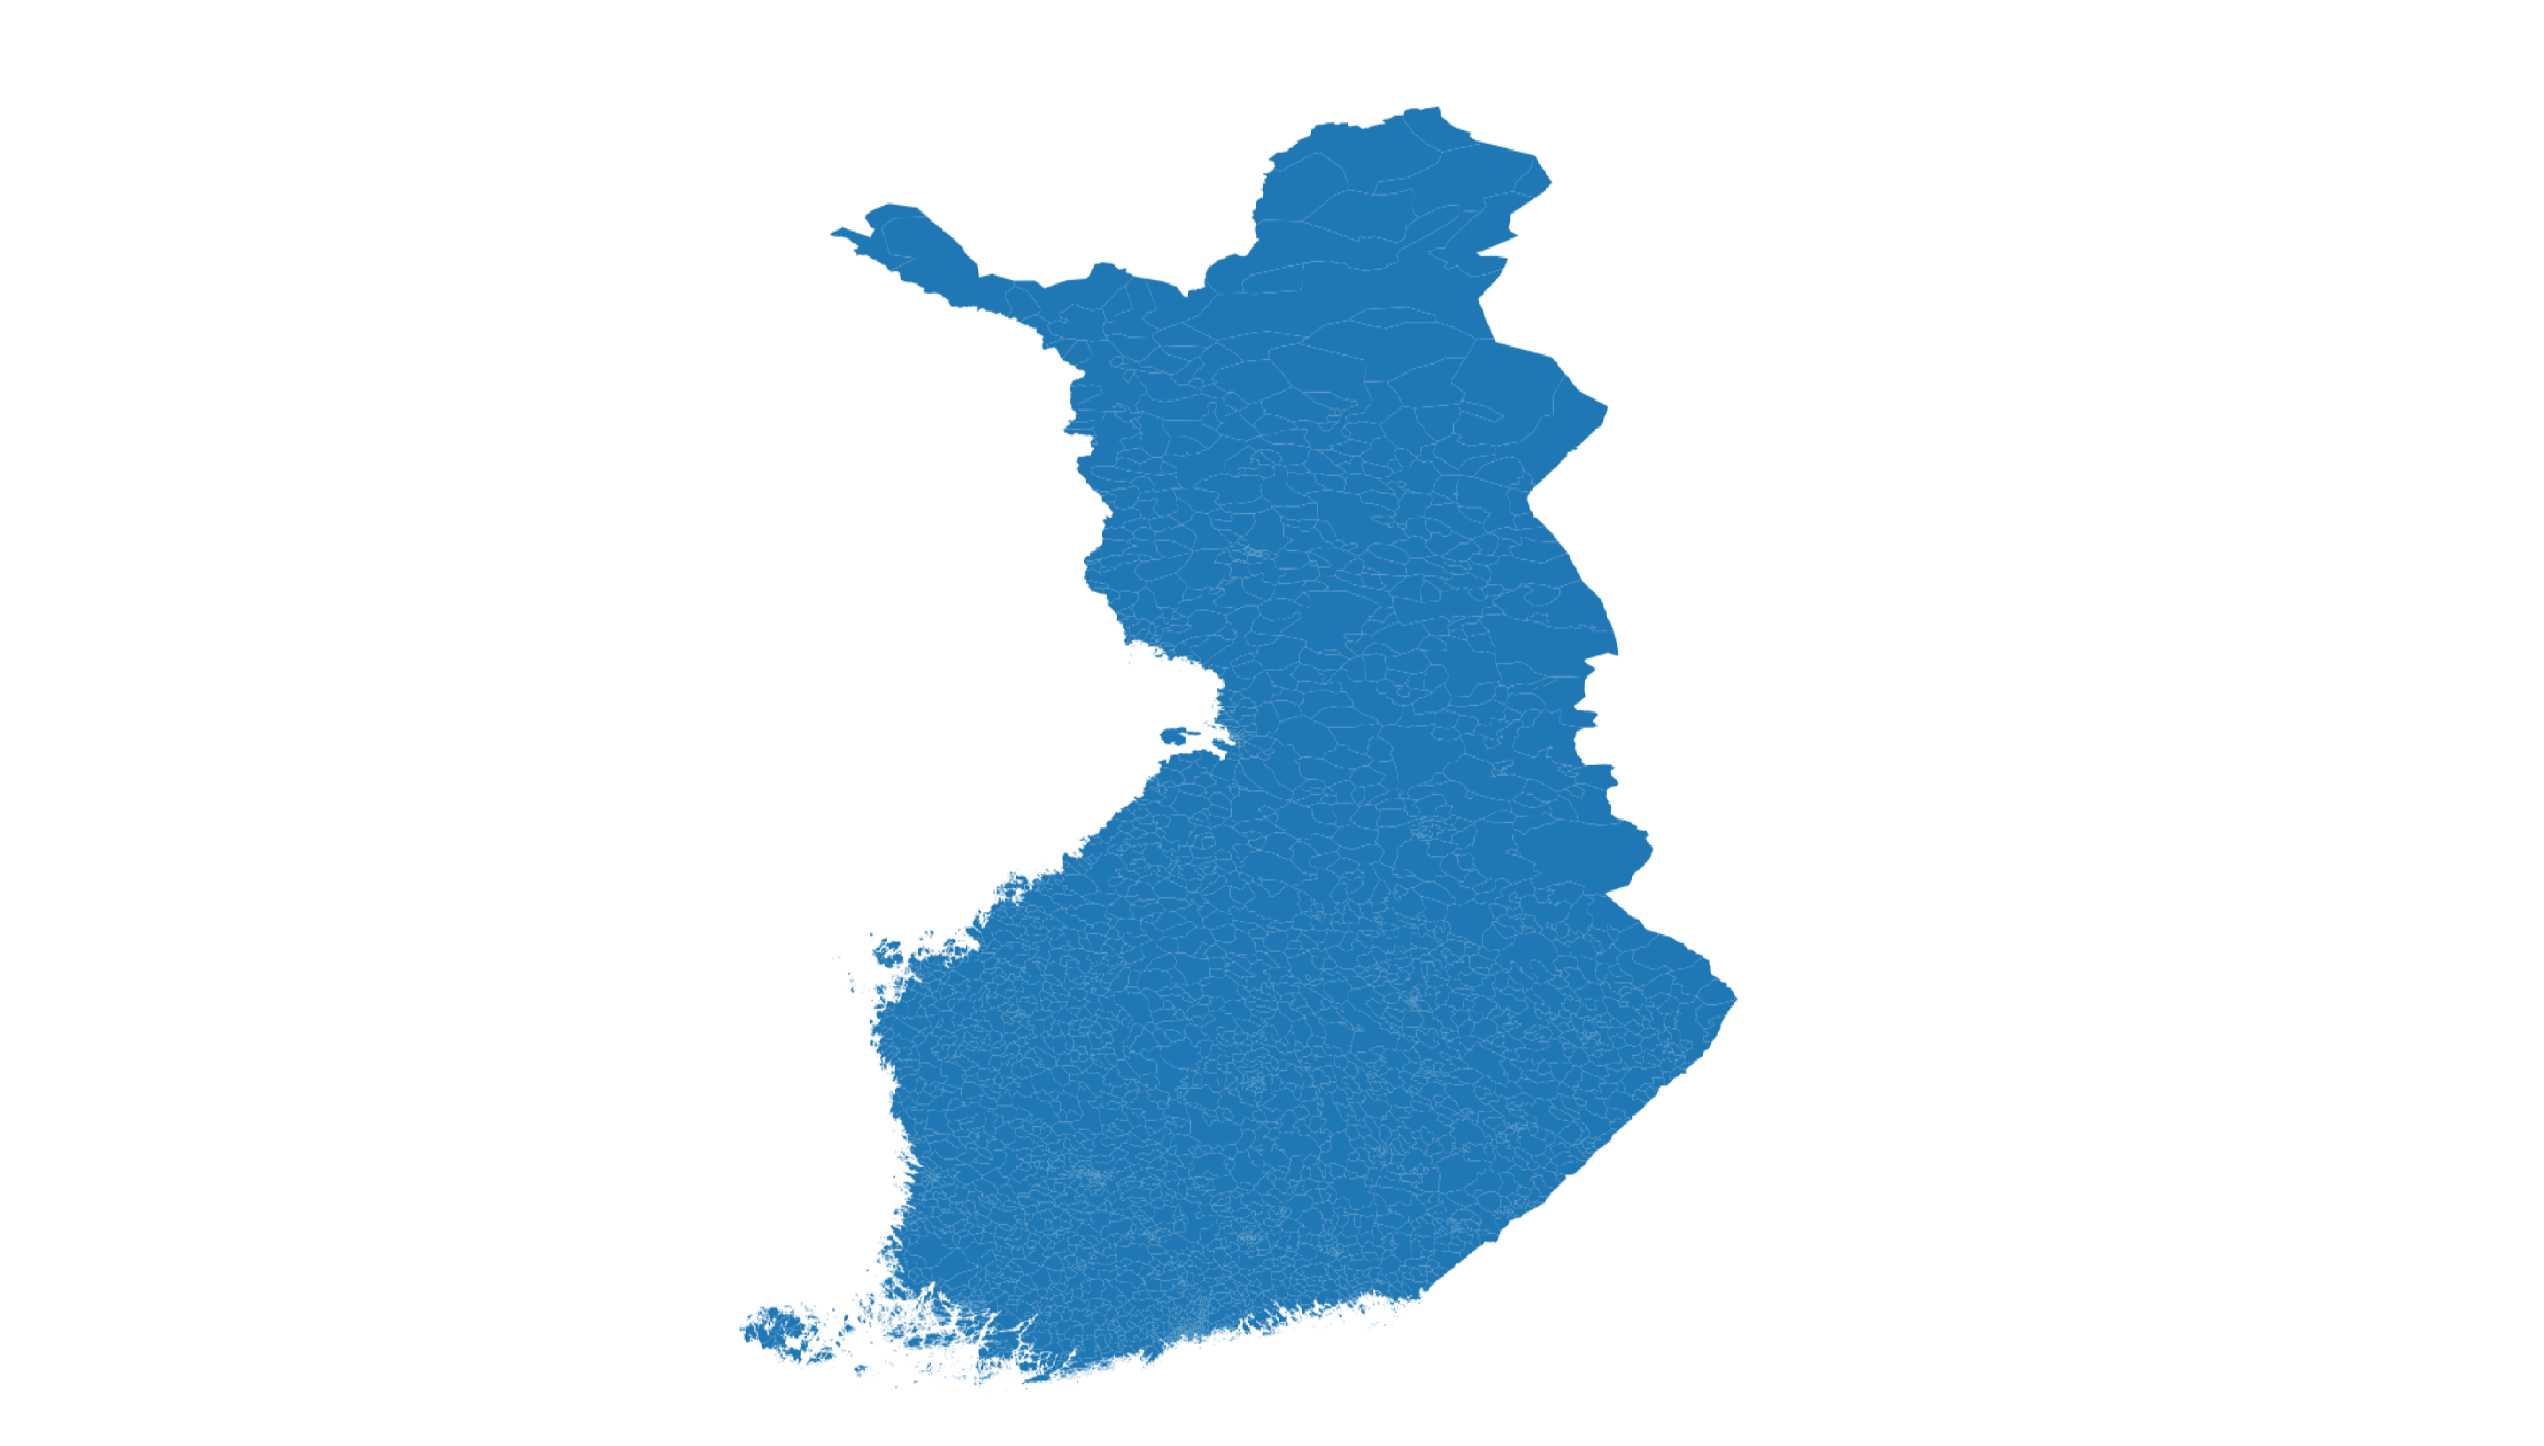
With the full postal code dataset you can create similar map than below. You also need to leave out the plot’s x and y limits and possibly the background map.
Interactive map of zip code data in Python
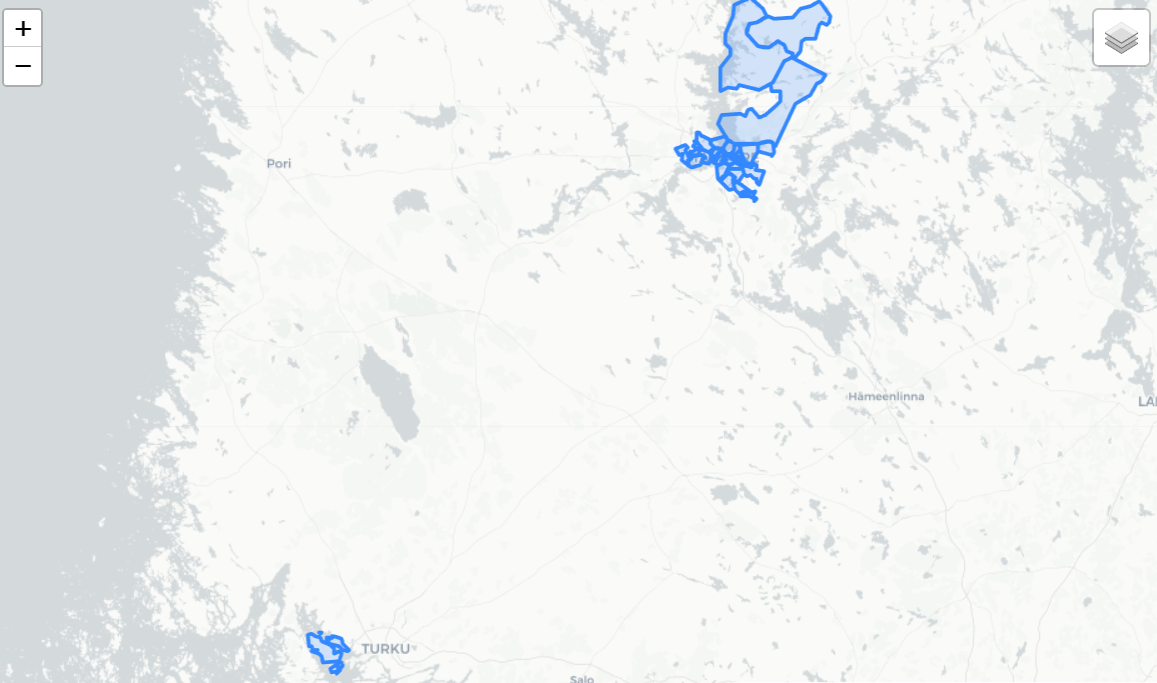
You can create an interactive map in Python notebooks with the following script. The code requires the folium library to be installed.
import folium

m = folium.Map(
    location=[61.1, 23.1],
    tiles="cartodbpositron",
    zoom_start=8,
)

input_file = "finland-postal-codes-sample.geojson"

folium.GeoJson(input_file, name="geojson").add_to(m)

folium.LayerControl().add_to(m)

m
The map can be zoomed in the notebook and moved with the mouse.
Write a new comment
The name will be visible. Email will not be published. More about privacy.