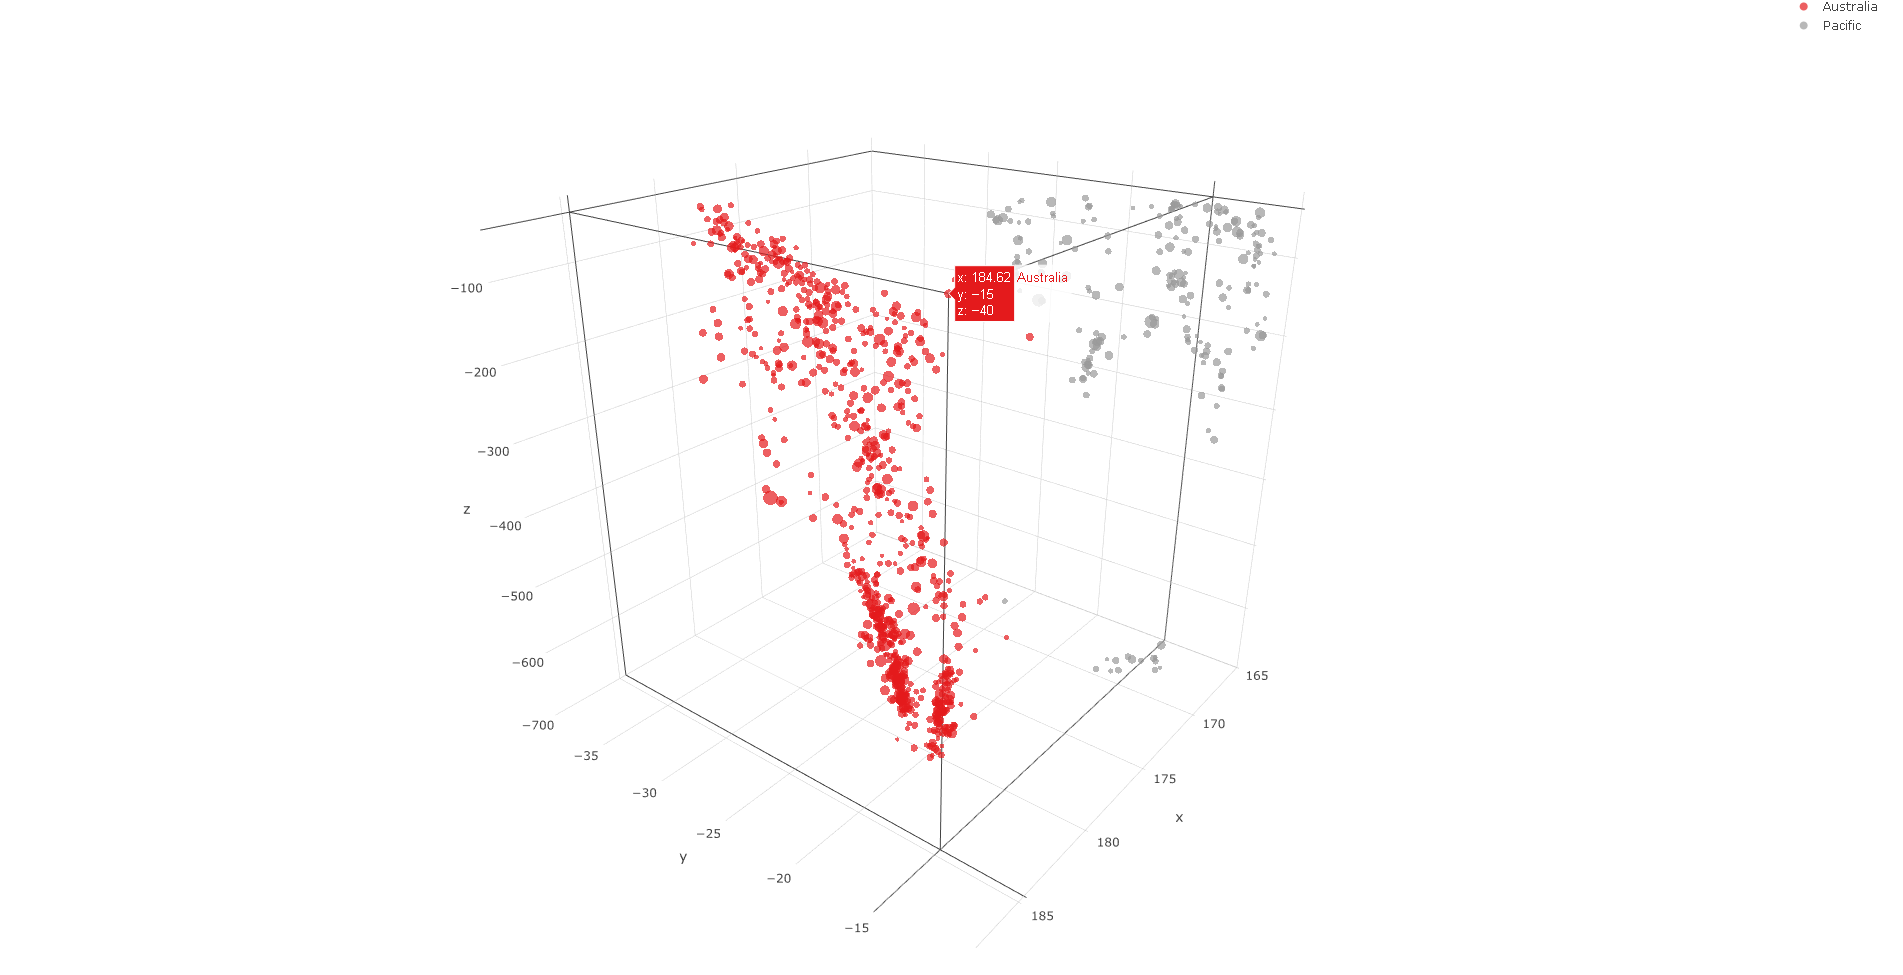
The built-in dataset quakes in RStudio had 1000 records of earthquakes nearby Fiji. The first year of observations is 1964 but the last year remains unknown. Essential variables to perform the visualization were map coordinates, the depth of the quake and the magnitude.
From research to visualization
The very first thing I did was to take look at Google Maps and find Fiji. After that I found out the tectonic plate joints from another map. That wat I realized that the plates actually match quite nicely with the data. The longitude and latitude coordinates visualized in a world map revealed two very clearly distinct groups of records. From this I deducted that the western one is Australian and the eastern one is the Pacific plate. But I can wrong though…
Finally I plotted a 3D bubble chart where depth and magnitude were visualized along the map coordinated. I also combined the kmeans clustering algorithm to determine which tectonic plate each record belongs to.
See the result from the video below:
This is the link to download the R-code:
quakes.R
Here is the RStudio built-in dataset as CSV:
quakes.csv
.
Download the earthquake data and clustering results as Excel-file:
quakes.xlsx
There occured some challenges with plotly visualization library but after a few attempts I managed to make it work. Another option would be to use plot3d function from the rgl library.


